
Here’s an example similar to my other Blog post Instant Monitoring of Windows Services. Instead, this blog demonstrates monitoring Performance Counters and using alerts to fire off a scheduled task. This scheduled task fires off a PowerShell script which in turn fires off an Azure Function, which in turn fires off an SMS text message and records an entry in a Log Analytics custom log. All this happens sequentially in the space of about 5 seconds.
This blog demonstrates monitoring these 3 basic performance counters:
- Processor(_Total)\% Processor Time
- Memory\% Committed Bytes In Use
- LogicalDisk(C:)\% Free Space

You could monitor more counters, another blog post later will let you know how you can do this.
Components
Here are the components of this solution, bearing in mind all this is set up fully automatically on each client by using the script below.
- Performance Counters
- Scheduled Task
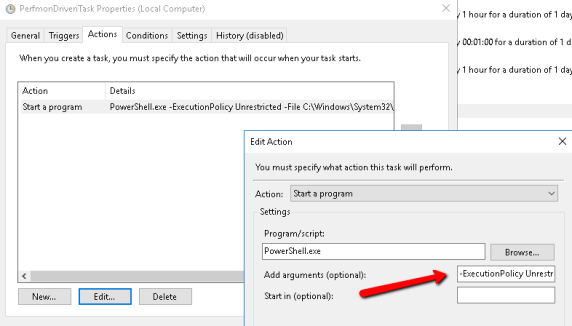
-ExecutionPolicy Unrestricted -File C:\Windows\System32\PerfmonDrivenTask.ps1 $(Arg0)
- PowerShell script | Takes the Arguments from the Perfmon Alert and uses this to construct the message to be sent as an SMS and send to the Log Analytics custom log.
# Message to send and add to the Log Analytics Custom Log
$Message = ('{1}{0}{2}{0}{3}{0}{4}' -f " ", $Args[0], $Args[1], $Args[2], $env:computername) -replace '/', '-'
Backend Setup (Manual)
The backend is set up once only. As per my other blog, setup the Azure Function, Log Analytics Workspace & Telstra DEV account.
Once you have the Azure Function, Log Analytics Workspace & Telstra DEV account setup, The script at the very bottom sets up everything on the client automatically.
Client Setup (Automated)
Once the backend is set up, the Script further below fully automates the setup of each client. Good thing is, you can run this over and over again, it will only make sure everything is set in place again.
- Run PowerShell ISE as administrator if running this on the actual machine
- Within the top 33 lines, change the variables to suite your setup:
- $LogAnalyticsCustomerID – Obtain workspace ID and key
- $LogAnalyticsPrimaryKey – Obtain workspace ID and key
- $Telstra_app_key – From https://dev.telstra.com/
- $Telstra_app_secret – From https://dev.telstra.com/
- $tel_numbers – One or many mobile numbers to send the SMS to
- $FunctionUri – Your own Azure Functions URI
- To run this remotely, you could run this using Remote PowerShell.
- You could set this up using Group Policy
Testing
If you want to test that this is working, it’s pretty easy, use this tool to put strain on the CPU & Memory.
This file contains hidden or bidirectional Unicode text that may be interpreted or compiled differently than what appears below. To review, open the file in an editor that reveals hidden Unicode characters.
Learn more about bidirectional Unicode characters
| ### RUN AS ADMINISTRATOR | |
| # This script here string, will be copied to the local computer to be run locally | |
| # Change the variables in this script, they are at the top in this here string | |
| $script = @' | |
| # Testing, $args is an array object ($args | Out-File "C:\Scripts\PerformanceAlert.txt" –Append) | |
| ######################################### | |
| # Replace with your Workspace ID | |
| $LogAnalyticsCustomerID = "Workspace ID" | |
| # Replace with your Log Analytics workspace Primary Key | |
| $LogAnalyticsPrimaryKey = "workspace Primary Key" | |
| #Specify the name of the record type that we'll be creating. | |
| $LogType = "LocalPerfMon" # To be used to search for as a custom log e.g. Type=LocalPerfMon_CL | |
| # Telstra DEV API Key – https://dev.telstra.com | |
| $Telstra_app_key = "Telstra DEV API Key" | |
| # Telstra DEV App Secret – https://dev.telstra.com | |
| $Telstra_app_secret = "Telstra DEV App Secret" | |
| # Mobile numbers to send, comma separated (with space), each number enclosed in single quotes | |
| $tel_numbers = "'+61412345678', '+61498765432'" | |
| # Message to send and add to the Log Analytics Custom Log | |
| $Message = ('{1}{0}{2}{0}{3}{0}{4}' -f " ", $Args[0], $Args[1], $Args[2], $env:computername) -replace '/', '-' | |
| $FunctionUri = 'https://marcfunction1.azurewebsites.net/api/EventDrivenFunction/{0}/{1}/{2}/{3}/{4}/{5}/{6}' ` | |
| -f $LogAnalyticsCustomerID, $LogAnalyticsPrimaryKey, $LogType, $Telstra_app_key, $Telstra_app_secret, $tel_numbers, $Message | |
| Invoke-RestMethod -Uri $FunctionUri | |
| '@ | |
| # Create the script on the local computer | |
| $ScriptFile = "$($env:SystemDrive)\Windows\System32\PerfmonDrivenTask.ps1" | |
| Remove-Item -Path $ScriptFile -Force -ErrorAction SilentlyContinue | |
| Set-Content -Path $ScriptFile -Value $Script | |
| ##################################################################################### | |
| ##################################################################################### | |
| <# Create the Scheduled Task – no trigger, a perfmon alert is the trigger | |
| Runs the PowerShell script above | |
| Takes the $args object array from the perfmon alert and feeds this to the above script | |
| Several Args are utilised in the above script $Args[0], $Args[1], $Args[2] | |
| #> | |
| $taskName = "PerfmonDrivenTask" | |
| $Path = 'PowerShell.exe' | |
| $Arguments = '-ExecutionPolicy Unrestricted -File {0} {1}Arg0{2}' -f $ScriptFile, "`$(", ")" | |
| # Quick Clean-up | |
| Unregister-ScheduledTask -TaskName $taskName -Confirm:$false -ErrorAction SilentlyContinue | |
| # This removes empty last line at the end of the text file | |
| $in = [System.IO.File]::OpenText($ScriptFile) | |
| $text = ($in.readtoend()).trim("`r`n") | |
| $in.close() | |
| $stream = [System.IO.StreamWriter]$ScriptFile | |
| $stream.write($text) | |
| $stream.close() | |
| $Service = new-object -ComObject ("Schedule.Service") | |
| $Service.Connect() | |
| $RootFolder = $Service.GetFolder("\") | |
| $TaskDefinition = $Service.NewTask(0) # TaskDefinition object https://msdn.microsoft.com/en-us/library/windows/desktop/aa382542(v=vs.85).aspx | |
| $TaskDefinition.RegistrationInfo.Description = '' | |
| $TaskDefinition.Settings.Enabled = $True | |
| $TaskDefinition.Settings.AllowDemandStart = $True | |
| $TaskDefinition.Settings.DisallowStartIfOnBatteries = $False | |
| # Expiry time if needed # $TaskEndTime = [datetime]::Now.AddMinutes(30);$Trigger.EndBoundary = $TaskEndTime.ToString("yyyy-MM-dd'T'HH:mm:ss") | |
| <# | |
| Advanced XML filtering in the Windows Event Viewer | |
| https://blogs.technet.microsoft.com/askds/2011/09/26/advanced-xml-filtering-in-the-windows-event-viewer/ | |
| #> | |
| $Action = $TaskDefinition.Actions.Create(0) | |
| $Action.Path = $Path | |
| $action.Arguments = $Arguments | |
| $RootFolder.RegisterTaskDefinition($taskName, $TaskDefinition, 6, "System", $null, 5) | Out-Null | |
| ##################################################################################### | |
| ##################################################################################### | |
| # Create the Perfmon Alerts | |
| $xml = @' | |
| <?xml version="1.0" encoding="UTF-16"?> | |
| <DataCollectorSet> | |
| <Status>1</Status> | |
| <Duration>0</Duration> | |
| <SchedulesEnabled>1</SchedulesEnabled> | |
| <LatestOutputLocation>%systemdrive%\PerfLogs\Admin\Alert\PerformanceAlerts</LatestOutputLocation> | |
| <Name>Alert</Name> | |
| <OutputLocation>%systemdrive%\PerfLogs\Admin\Alert\PerformanceAlerts</OutputLocation> | |
| <RootPath>%systemdrive%\PerfLogs\Admin\PerformanceAlerts</RootPath> | |
| <Segment>-1</Segment> | |
| <SegmentMaxDuration>0</SegmentMaxDuration> | |
| <SegmentMaxSize>50</SegmentMaxSize> | |
| <SerialNumber>20</SerialNumber> | |
| <SubdirectoryFormat>3</SubdirectoryFormat> | |
| <SubdirectoryFormatPattern>yyyyMMdd\-NNNNNN</SubdirectoryFormatPattern> | |
| <TaskRunAsSelf>0</TaskRunAsSelf> | |
| <UserAccount>SYSTEM</UserAccount> | |
| <StopOnCompletion>0</StopOnCompletion> | |
| <AlertDataCollector> | |
| <DataCollectorType>3</DataCollectorType> | |
| <Name>CPU Percent</Name> | |
| <Alert>\Processor(_Total)\% Processor Time>90</Alert> | |
| <AlertDisplayName>\Processor(_Total)\% Processor Time>90</AlertDisplayName> | |
| <EventLog>0</EventLog> | |
| <SampleInterval>15</SampleInterval> | |
| <Task>PerfmonDrivenTask</Task> | |
| <TaskRunAsSelf>0</TaskRunAsSelf> | |
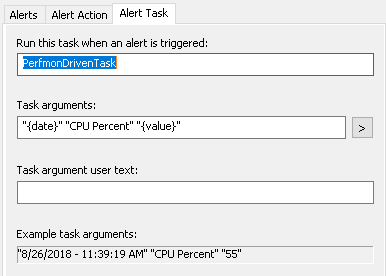
| <TaskArguments>"{date}" "CPU Percent" "{value}"</TaskArguments> | |
| </AlertDataCollector> | |
| <AlertDataCollector> | |
| <DataCollectorType>3</DataCollectorType> | |
| <Name>Memory Percent</Name> | |
| <Alert>\Memory\% Committed Bytes In Use>90</Alert> | |
| <AlertDisplayName>\Memory\% Committed Bytes In Use>90</AlertDisplayName> | |
| <EventLog>0</EventLog> | |
| <SampleInterval>15</SampleInterval> | |
| <Task>PerfmonDrivenTask</Task> | |
| <TaskRunAsSelf>0</TaskRunAsSelf> | |
| <TaskArguments>"{date}" "Memory Percent" "{value}"</TaskArguments> | |
| </AlertDataCollector> | |
| <AlertDataCollector> | |
| <DataCollectorType>3</DataCollectorType> | |
| <Name>Low Disk (C) Space</Name> | |
| <Alert>\LogicalDisk(C:)\% Free Space<10</Alert> | |
| <AlertDisplayName>\LogicalDisk(C:)\% Free Space<10</AlertDisplayName> | |
| <EventLog>0</EventLog> | |
| <SampleInterval>3600</SampleInterval> | |
| <Task>PerfmonDrivenTask</Task> | |
| <TaskRunAsSelf>0</TaskRunAsSelf> | |
| <TaskArguments>"{date}" "C Drive Free Space Percent" "{value}"</TaskArguments> | |
| </AlertDataCollector> | |
| <DataManager> | |
| <Enabled>0</Enabled> | |
| <CheckBeforeRunning>0</CheckBeforeRunning> | |
| <MinFreeDisk>0</MinFreeDisk> | |
| <MaxSize>0</MaxSize> | |
| <MaxFolderCount>0</MaxFolderCount> | |
| <ResourcePolicy>0</ResourcePolicy> | |
| <ReportFileName>report.html</ReportFileName> | |
| <RuleTargetFileName>report.xml</RuleTargetFileName> | |
| <EventsFileName> | |
| </EventsFileName> | |
| </DataManager> | |
| </DataCollectorSet> | |
| '@ | |
| $DataCollectorName = 'PerformanceAlerts' | |
| $DataCollectorSet = New-Object -COM Pla.DataCollectorSet | |
| $DataCollectorSet.SetXml($xml) | |
| # Quick Clean-up | |
| $datacollectorset.Query("$DataCollectorName",$null) | |
| $datacollectorset.stop($false) | |
| Start-Sleep -Seconds 5 | |
| $datacollectorset.Delete() | |
| $DataCollectorSet.Commit("$DataCollectorName" , $null , 0x0003) | Out-Null | |
| $DataCollectorSet.Start($false) | |
| # Set the Trigger for the Data Collector to run at StartUp | |
| $T = New-ScheduledTaskTrigger -AtStartup | |
| Set-ScheduledTask -TaskPath \Microsoft\Windows\PLA\ -TaskName PerformanceAlerts -Trigger $T |
