
Monitoring & Logging on-prem Linux devices/servers takes into consideration that the majority of network devices and network appliances are all Linux based and there are also a large number of Linux servers in circulation.
A large number of my customers use a large number of Linux servers and network devices – which all need to be monitored centrally using a service which is cloud agnostic and full hybrid – Log Analytics.

Here’s how it works…. Focusing on the center piece of the above diagram:
If the Log Analytics agent computer has an Rsyslog daemon:
- The Azure Security Center config file for rsyslog is located at /etc/rsyslog.d/security-config-omsagent.conf
- The Log Analytics config file for rsyslog is located at /etc/rsyslog.d/95-omsagent.conf
If the Log Analytics agent computer has an Syslog-ng daemon:
- The Azure Security Center config file for syslog-ng is location at /etc/syslog-ng/security-config-omsagent.conf
- The Log Analytics config file for syslog-ng is location at /etc/syslog-ng/syslog-ng.conf
Log Analytics / Azure Security Center support collection of messages sent by rsyslog or syslog-ng, where rsyslog is the default daemon. The default syslog daemon on version 5 of Red Hat Enterprise Linux, CentOS, and Oracle Linux version (sysklog) is not supported for syslog event collection. To collect syslog data from this version of these distributions, the rsyslog daemon should be installed and configured to replace sysklog.
SNMP to Log Analytics
SNMP data can also be collected in two ways: with polls – where a managing system probes an SNMP agent to gather values for specific properties, or with traps – where an SNMP agent forwards events or notifications to a managing system. Traps are most often used as event notifications, while polls are more appropriate for stateful health detection or collecting performance metrics.
More info and how to set this up, see this blog.
Why to Log Analytics?
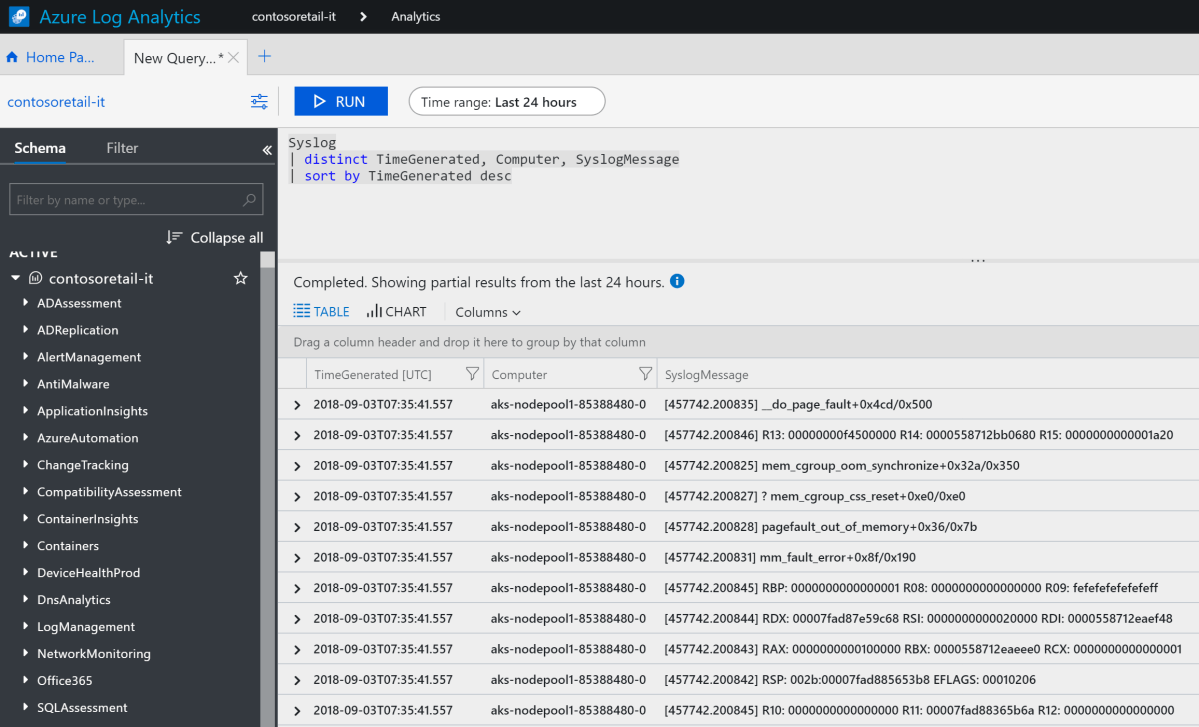
So that everything is logged into the one place – Azure, one single bill from one of the most trusted enterprise companies on the planet – Microsoft and using a simple yet powerful query language that is optimised to perform and handle free-text data at cloud-scale. All Azure monitoring services, e.g. Azure Monitor, Log Analytics, Azure Security Center, Network Watcher plus more all leverage the same backend query language – screenshot below:
Also… as you know you can send practically any data to Log Analytics, how you want and when you want.
Then you can easily create a whole bunch of awesome dashboards to report back on.
Further Reading:
- Syslog data sources in Log Analytics – one of the sources for this blog post
- Connect security solutions to Security Center – one of the sources for this blog post
- Collect alerts from Nagios and Zabbix in Log Analytics from OMS Agent for Linux
- Collect performance counters for Linux applications in Log Analytics
- collect performance counters for specific applications such as MySQL & Apache HTTP Server
